Map Tab
Deep Dive
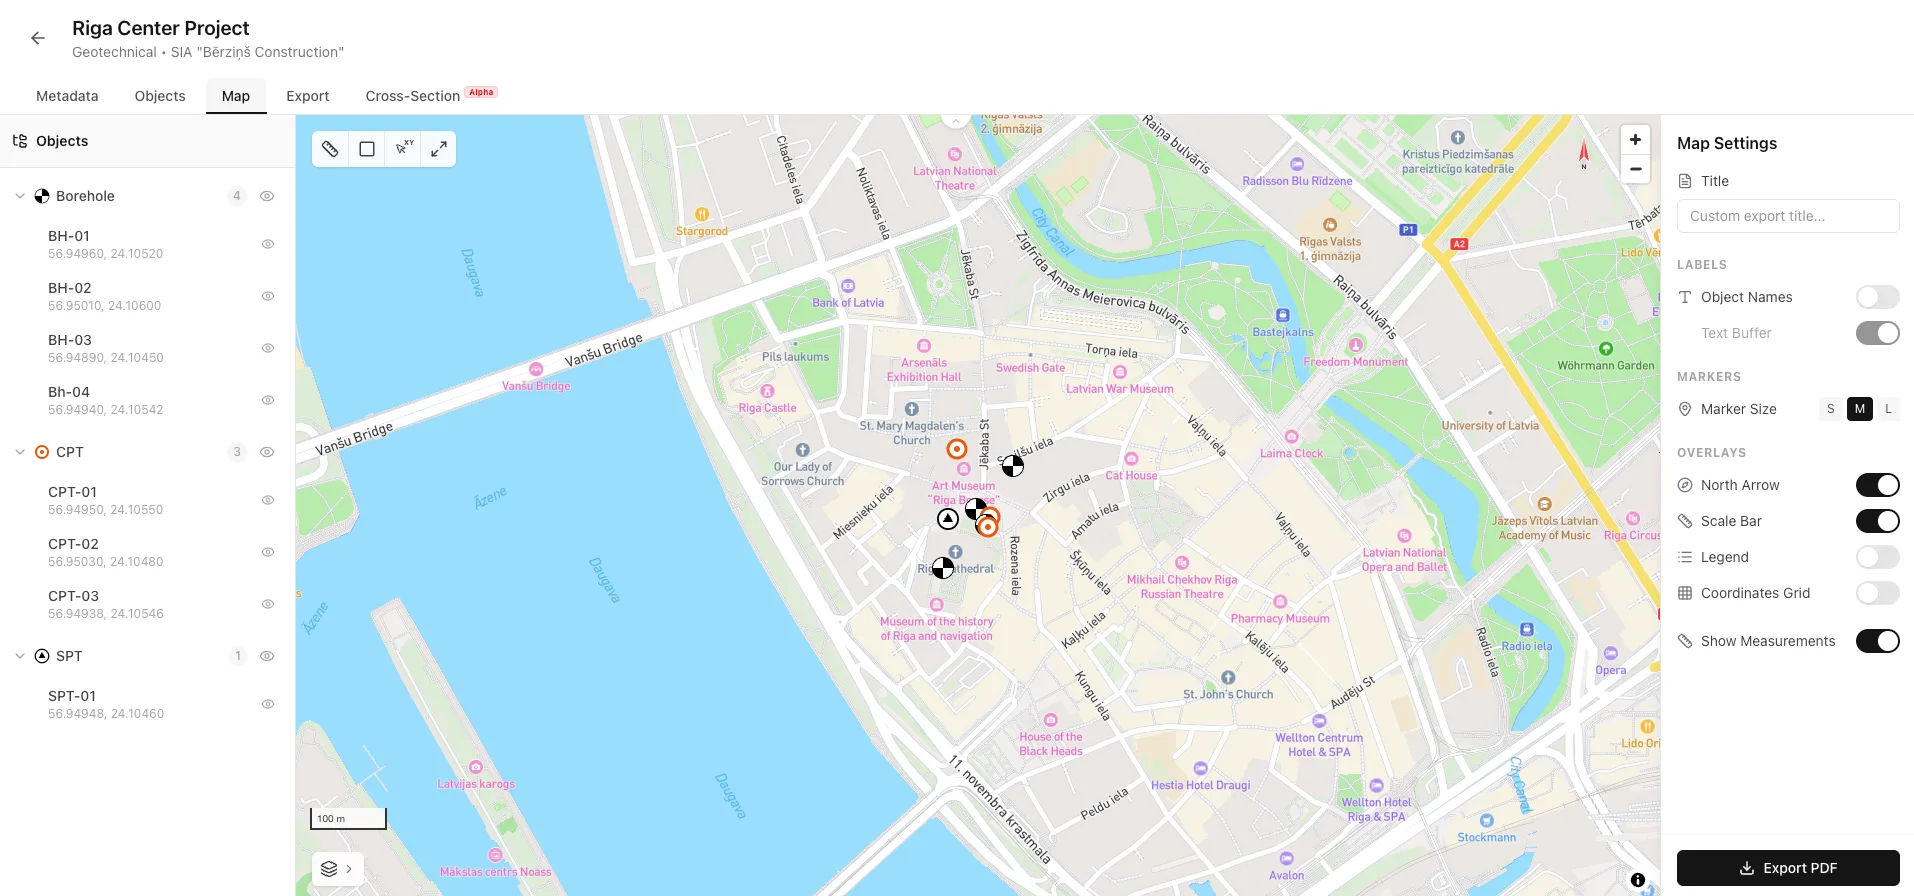
The Map tab provides a full GIS-style view of your project with interactive layers, measurement tools, and professional PDF export. Visualize object locations, measure distances and areas, and create publication-ready site maps.
Interface Overview
The Map tab is divided into three main areas:
- Object groups organized by type with visibility controls
- Full-screen Mapbox map with measurement tools and basemap options
- Map display settings and PDF export options
Layers Sidebar
The sidebar on the left displays all objects grouped by type. Control which objects appear on the map and customize their appearance.
Object Groups
Objects are automatically grouped by type (Boreholes, CPTs, SPTs). Each group shows a count badge and can be expanded or collapsed.
- Click the group name to expand or collapse and see individual objects
- Click the eye icon to show/hide all objects of that type on the map
- Within an expanded group, toggle visibility for each object separately
- Each object shows its coordinates in the list for quick reference
Changing Layer Icons
You can customize the icon used for each object type to match your preferred visualization style.
- Click the icon next to the group name (not the eye icon)
- The Icon Selector modal opens showing available icons
- Choose from various styles: standard geotechnical symbols, colored circles, numbered pins, or custom designs
- Click an icon to apply it - all objects of that type update immediately
Practical Example
Use different colored icons to visually distinguish between completed and ongoing investigations, or use numbered pins when object names are long.

Saved Measurements
Saved measurements appear in the sidebar below object groups. Each saved measurement shows its value (distance or area) and can be deleted by clicking the trash icon that appears on hover.

Map Controls
The map provides several interactive controls for navigation and data capture.
Basemap Styles
Click the Layers button in the bottom-left corner to change the map's base layer. Available styles include:
- Click the Layers button in the bottom-left corner to change the map's base layer. Available styles include:

Navigation
- Use the +/- buttons in the top-right corner, scroll wheel, or pinch gesture
- Click and drag the map to move around
- Click the Maximize button in the measurement toolbar to zoom the map to show all objects


Object Markers
Each object with coordinates appears as a marker on the map. Click a marker to see a popup with:
- Object name
- Object type
- "Open Object" button to navigate directly to that object's detail page
Measurement Tools
The measurement toolbar in the top-left corner provides tools for measuring distances and areas directly on the map.
Distance Tool
Measure distances along a path. Click multiple points on the map to create a multi-segment line. Total distance is displayed in meters or kilometers.
Area Tool
Measure area of a polygon. Click at least 3 points to create a closed shape. Shows area (m², hectares, or km²) and perimeter.
XY Coordinate Picker
Display live cursor coordinates. Right-click anywhere on the map to copy coordinates to clipboard in "lat, lon" format.
Fit All Objects
Automatically zoom and pan the map to fit all visible objects within the view with comfortable padding.
Using the Measurement Tools
- Click the Distance (ruler) or Area (square) button in the toolbar - the button becomes highlighted and cursor changes to crosshair
- Click on the map to add measurement points. A dashed line connects your points
- The results panel shows the current measurement value and point count
- Stores the measurement permanently in the project (appears in sidebar)
- Removes the current measurement and resets the tool
- Click the tool button again or the X in the panel to exit measurement mode


Practical Example
Use the distance tool to measure the spacing between boreholes to ensure they meet investigation grid requirements. Use the area tool to measure the project site boundary for reporting purposes.Measurement Accuracy
Measurements use the Haversine formula for distances and spherical polygon area calculation, accounting for Earth's curvature. Results are accurate for typical project scales. For very large areas (>100 km²), consider specialized GIS software.
Map Settings
The settings panel on the right controls how the map displays and what appears in PDF exports.
Export Title
Enter a custom title that will appear on the exported PDF map. Leave blank to use the project name.
Labels Settings
- Toggle to show object names as labels above each marker on the map
- When names are shown, adds a white outline around text for better readability against the map background
Marker Settings
Choose Small (S), Medium (M), or Large (L). Affects both map display and PDF export
Map Overlays
Toggle these elements on the map and in PDF exports:
- Shows cardinal direction indicator in the top-right area of the map
- Shows distance scale in metric units (meters/kilometers) in the bottom-left corner
- Shows legend with object type icons and names (in PDF export)
- Overlays a coordinate grid on the map (in PDF export)
- Toggle whether saved measurements appear on the map and in exports

PDF Map Export
Generate a professional PDF map showing your project site with all visible objects and overlays.
Before Exporting
- Position the map view exactly as you want it in the PDF (zoom and pan)
- Use the Layers panel to show/hide the objects you want to include
- Configure settings: title, labels, overlays, marker size
- Save any measurements you want to include
Generating the PDF
- Click the "Export PDF" button at the bottom of the settings panel
- The button shows "Exporting..." while the PDF is generated
- The PDF downloads automatically to your browser's download folder
What's Included in the PDF
- High-resolution map matching your current view
- All visible object markers with their configured icons
- Object name labels (if enabled)
- Overlays based on your settings (north arrow, scale bar, legend, grid)
- Saved measurements with their values (if enabled)
- Custom title or project name

Practical Example
Export a site location map for your geotechnical report. Use satellite imagery as the basemap, show all borehole locations with names, add the scale bar and north arrow, and include a measurement showing the property boundary. Add a custom title like "Site Investigation Location Plan".Related Features
The Map tab connects to other parts of Borebase:
- Import objects with coordinates, view the minimap, and manage object data
- Create detailed borehole logs, CPT graphs, and multi-page reports
Ready to visualize your site investigations?