Export Tab
Deep Dive
The Export tab is your professional report generation center. Create customizable borehole logs, CPT graphs, and SPT charts with drag-and-drop simplicity. Export individual PDFs or batch export entire projects.
Layout List
When you first open the Export tab, you see the Layout List - a table of all saved export layouts in the project. Each layout is a reusable template that defines how your data will appear in PDF reports.
Layout Table Columns
- The layout identifier. Click to open the layout editor.
- Page size - A4, A3, or Letter.
- Portrait or Landscape orientation.
- Number of data columns in the layout (2-8).
- Number of objects assigned to this layout.
- Last modification date.

Layout Actions
- Save this layout as a template. Templates appear in other projects and can be quickly applied to new data.
- Create a copy of this layout. Useful for creating variations of an existing design.
- Remove the layout. This cannot be undone.

Creating New Layouts
Click the "+ New Layout" button to create a new export layout. You'll be taken to the layout editor where you can configure all settings and add data columns.

Migrate Layout
Click "Migrate Layout" to import a layout from another project. This opens a modal where you can select a source project and choose which layout to copy. The layout settings are imported, but you'll need to assign new objects from the current project.


Practical Example
You created a perfect layout for a client in a previous project. Use Migrate to bring that exact layout into your new project, then just drag in the new borehole and CPT data.Layout Editor Interface
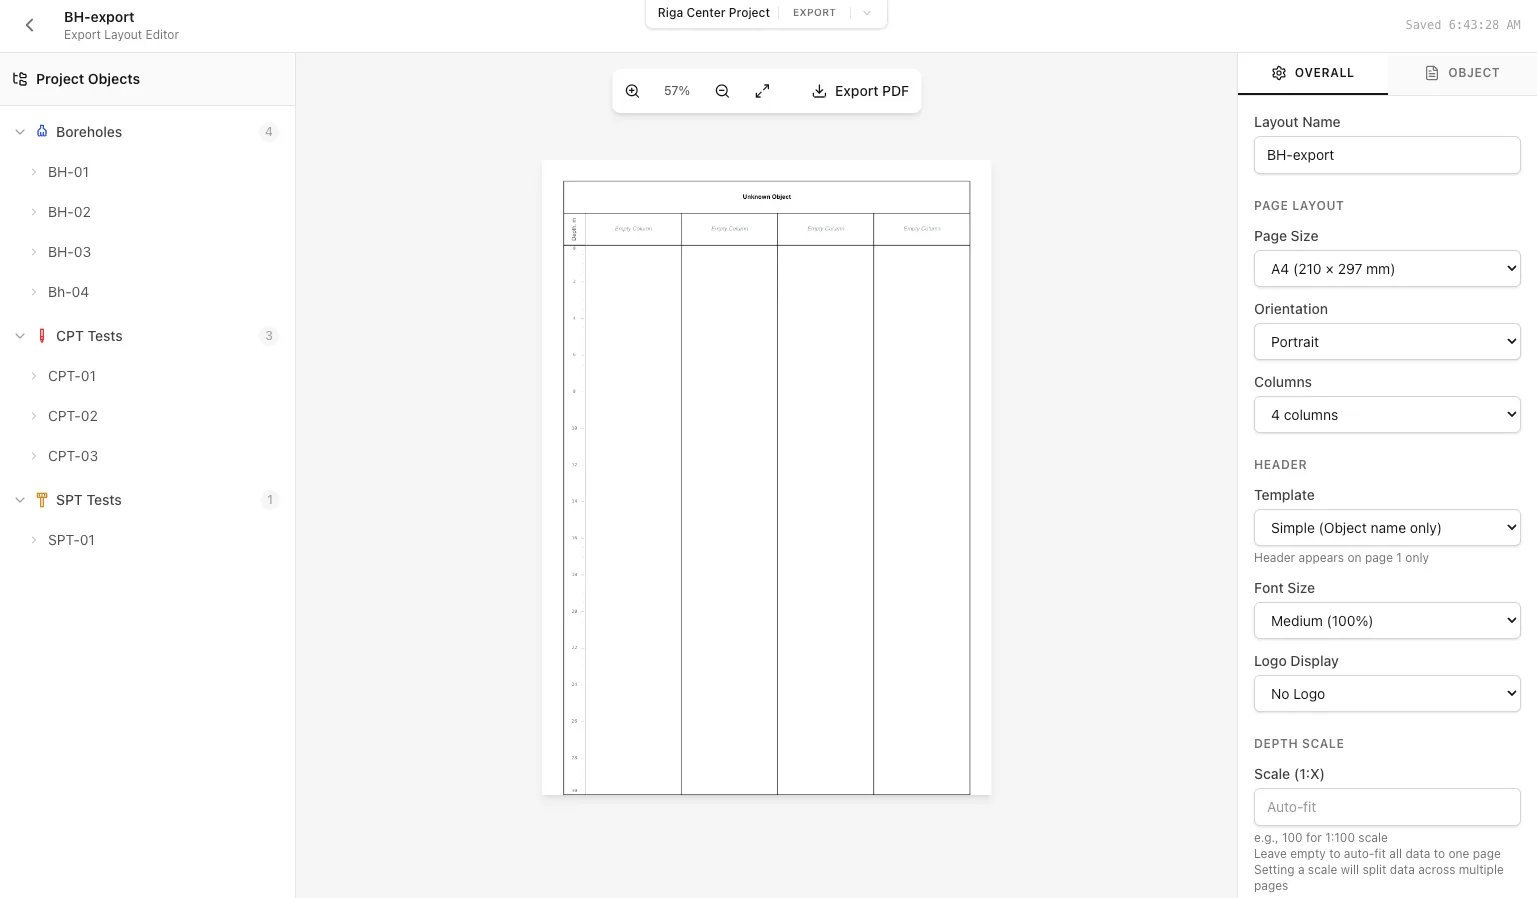
The layout editor is a three-panel interface for designing your export documents:
- Tree view of all project objects grouped by type (Boreholes, CPTs, SPTs). Expand an object to see available data items that can be dragged to columns.
- Real-time preview of your export document. Shows exactly how the PDF will look. Supports zoom (scroll wheel) and pan (click and drag).
- Two tabs: "Overall Settings" for document-wide options, "Object Settings" for configuring individual data items.
Canvas Controls
- Use scroll wheel or +/- buttons. Range: 25% to 400%.
- Click and drag anywhere on the canvas to pan.
- Click the maximize button to fit the entire document in view.
- Shows current page count. Multi-page documents display red dotted lines at page breaks.
Dragging Data Items to Columns
The left panel shows all available data items organized by object. To add data to your export:
- Expand an object type (Boreholes, CPTs, or SPTs) by clicking the chevron
- Expand a specific object to see its available data items
- Drag a data item to one of the columns on the canvas
- The column highlights when you can drop. Release to place the item.
Borehole Data Items
- Visual representation of soil layers using hatch patterns. The main element of a borehole log.
- Text labels showing soil type names, descriptions, and index codes for each layer.
- Well construction elements - casing, screen, grout, filter pack. Shows nested diameters.
- Sample markers showing where samples were taken, with depth ranges and sample types.
- Static groundwater level indicator - a horizontal blue triangle marker.
- Dynamic (pumping) water level indicator - shows water level during pumping tests.
CPT Data Items
- Interpreted soil layers based on Robertson SBT classification from Ic values.
- Text labels for CPT-interpreted soil types.
- Raw cone resistance graph (MPa).
- Sleeve friction graph (kPa).
- Pore pressure graph (kPa) - for CPTu tests.
- Calculated friction ratio (fs/qc × 100%).
- Pore pressure corrected cone resistance.
- Robertson soil behavior type index for classification.
- Estimated equivalent SPT N60 value from CPT data.
- Estimated undrained shear strength for cohesive soils.
Additional CPT Parameters
The system also supports: Speed, Qt (normalized), Fr (normalized), Bq, sigma_v0, sigma_v0_eff, Young's modulus, and Constrained modulus.SPT Data Items
- Raw SPT blow count (N = N2 + N3).
- Energy-corrected SPT value using 60% reference energy.
- Overburden-corrected N60 value.
- Estimated friction angles using Jamiolkowski, Hatanaka, and Wolff correlations.
- Estimated relative density using Kulhawy-Mayne and Skempton methods.
Overall Settings Panel
The "Overall Settings" tab in the right panel controls document-wide options:

Page Setup
- Identifier for this layout. Appears in the layout list.
- Choose A4 (210×297mm), A3 (297×420mm), or Letter (216×279mm).
- Portrait (vertical) or Landscape (horizontal).
- Number of data columns (2-8). More columns = narrower graphs.
Header Options
- None - No header
- Simple - Object name only
- Standard - Object, project, client, date
- Coords - Adds X/Y coordinates and elevation
- Detailed - Full header with all metadata and personnel
- Multiplier from 0.5× to 2.0× for header text scaling.
Logo Options
- None, Left, Right, Top, or Top (No Header). Controls where company logo appears.
- Choose from company logos uploaded in Settings. Academic accounts use Borebase logo.
Depth Scale
Controls how depth is mapped to page height. Options:
Note
Manual depth scales create professional-looking logs but deep objects may span multiple pages. Use Auto for quick single-page exports.Comments Block
- Toggle to add a text area below the data columns for notes, remarks, or signatures.
- Height in mm (10-100mm).
- Pre-fill text that appears in every export.
Export Language
Select the language for exported PDFs. This is independent of the UI language - you can work in English but export reports in Latvian, or vice versa. Affects header labels, data labels, and translated content.
Object Settings Panel
Click on any data item in the left panel (after it's been added to a column) to configure its specific settings. The "Object Settings" tab shows options for the selected item.

Graph Settings (CPT/SPT Graphs)
- Minimum value for the horizontal axis. Leave empty for auto-detection.
- Maximum value for the horizontal axis. Leave empty for auto-detection.
- Linear or Logarithmic scale. Use log scale for parameters with large value ranges like qc.
- Show/hide vertical grid lines on the graph.
Stratigraphy Hatch Settings
- Toggle horizontal lines between soil layers.
- Show depth values at layer boundaries.
Layer Names Settings
- Display the soil index code (e.g., "SM", "CL") alongside layer names.
- Display layer descriptions if available.
- Text size for layer names (Small, Medium, Large).
Sample Marker Settings
- Display the sample type label (e.g., "UD", "SPT", "Bulk").
- Display recovery percentage for each sample.
Water Level Settings
- Display the observation date next to the water level marker.
- Display any notes associated with the water level reading.
Construction Settings
- Toggle visibility of stratigraphy behind construction elements.
- Display labels for construction elements (casing, screen, etc.).
Adjusting Column Widths
You can resize individual columns by dragging the column borders on the canvas:
- Hover over the border between two columns
- The cursor changes to a resize cursor
- Click and drag left or right to adjust the width
- The last column automatically adjusts to fill remaining space
Batch Export
The Export Dialog allows you to generate PDFs for multiple objects at once. Click the "Export PDF" button in the toolbar to open the dialog.

Export Scopes
- Export only the objects currently in the layout. One PDF with all displayed data.
- Generate one PDF per borehole in the project, using the borehole columns from the layout as a template.
- Generate one PDF per CPT in the project, using the CPT columns from the layout.
- Generate one PDF per SPT in the project, using the SPT columns from the layout.
- Export borehole-CPT pairs together. Only available for boreholes with linked CPTs (set in CPT metadata).
- Export borehole-SPT pairs together.
- Export borehole with all related tests (CPT and SPT) in one PDF.
Practical Example
You have 20 boreholes and 15 CPTs in a project. Create one layout with a borehole and CPT side-by-side. Use "All Boreholes" to export 20 PDFs, each showing just the borehole data. Use "BH + CPT Pairs" to export PDFs showing boreholes alongside their related CPT data.Batch Export Process
- Select the desired export scope
- Click "Export"
- Progress bar shows current object being processed
- When complete, a ZIP file downloads automatically containing all PDFs
File Naming
PDFs are named after the object: "BH-01.pdf", "CPT-15.pdf". Pair exports use combined names: "BH-01_CPT-01.pdf".


Working with Templates
Templates allow you to reuse layout configurations across projects:
Saving as Template
- Create and configure a layout to your satisfaction
- In the layout list, click the Star icon next to the layout
- The layout is now saved as a template and will appear in all projects

Using a Template
- Open the Export tab in any project
- Click "Migrate Layout"
- Select your template from the list (templates are marked with a star)
- The layout settings are imported - now drag in objects from the current project

Use the Templates panel to add, rename, or remove report templates.

Best Practices
Layout Design
- Start with 4-5 columns for a balanced layout. Add more only if needed.
- Place stratigraphy hatch first (left side) as the reference column.
- Group related items: stratigraphy hatch + layer names, or qc + fs + Rf graphs together.
- Use "Standard" or "Coords" header template for professional reports.
Batch Export Tips
- Test your layout with one object before batch exporting the entire project.
- Use Auto scale for consistent single-page outputs across objects with varying depths.
- Use manual scale when consistent depth representation is required (e.g., comparing multiple logs).
Performance
- Large batch exports (50+ objects) may take a few minutes. Progress is shown in the dialog.
- Complex layouts with many graph columns export slower than simple layouts.
Related Guides
- Learn how to create and manage soil layers that appear in exports.
- Understand CPT data import and calculations for graph exports.
- Learn about SPT data management for export graphs.
- Overview of project object management.
Ready to create professional reports?