Water Levels Tab
Deep Dive
Track groundwater measurements over time, calculate specific capacity and drawdown, and visualize water level trends with interactive timeline graphs. Essential for hydrogeological assessments and pumping test analysis.
Interface Overview
The Water Levels tab is divided into three main areas with a resizable layout:
- Shows the total measurement count and "Add Measurement" button.
- Left side shows 4 calculated values (static depth, dynamic depth, drawdown, specific capacity). Right side displays an interactive timeline graph.
- Scrollable table with all water level records. All fields are inline-editable.
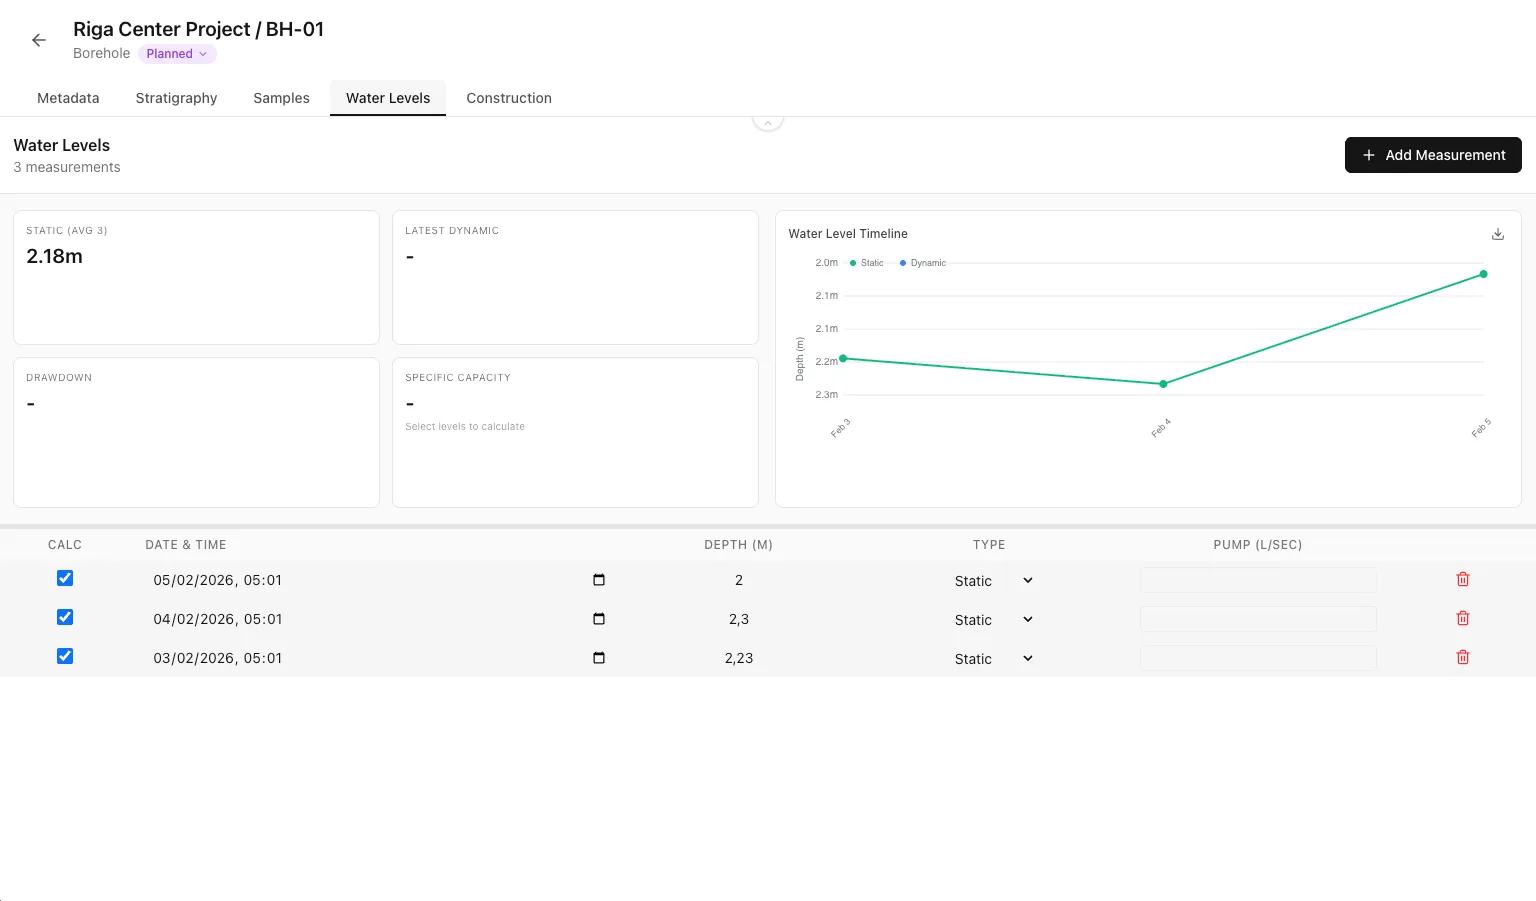
Resizable Layout
Drag the horizontal divider between the statistics/graph area and the table to resize. This lets you focus on either the visual analysis or the data table as needed.Adding Water Level Measurements
Click the "+ Add Measurement" button in the header to record a new water level reading.

Form Fields
- Measured depth to water from the top of the borehole (meters). Use decimal values (e.g., 3.45).
- Static (natural water level, no pumping) or Dynamic (water level during pumping test).
- Only available for dynamic measurements. The rate at which water is being pumped from the well.
- When the measurement was taken. Defaults to current date/time.
Form Fields
Click the "+ Add Measurement" button in the header to record a new water level reading.


Static vs Dynamic Water Levels
Static Water Level (SWL)
The natural water level in a well when no pumping has occurred. Measure this before any pumping test or after the well has fully recovered. Displayed in green on graphs.Dynamic Water Level (DWL)
The water level during pumping. Always deeper than static. Record the pumping rate alongside for specific capacity calculations. Displayed in blue on graphs.Practical Example
During a pumping test, record the static water level before starting (e.g., 5.20m). Then record dynamic levels at intervals (e.g., after 1 hour: 8.45m at 2.5 L/sec pumping rate). This data enables specific capacity calculation.Understanding the Statistics Cards
Four statistics cards provide key hydrogeological parameters. Values update based on your selection checkboxes.
Static Water Level Card
Shows the latest static water level depth. When measurements are selected for calculation, shows the average of selected static measurements.
Dynamic Water Level Card
Shows the latest dynamic water level depth. When measurements are selected, shows the average of selected dynamic measurements.
Drawdown Card
The difference between dynamic and static water levels. Indicates how much the water level drops during pumping.
Specific Capacity Card
A key well performance indicator measuring how much water can be pumped per unit of drawdown. Higher values indicate better well performance.
Specific Capacity Requirements
Specific capacity is only calculated when you have both static and dynamic measurements selected, and the dynamic measurements include a pumping rate. The card highlights in blue when calculation is active.Selecting Measurements for Calculations
Use the checkboxes in the "Calc" column to select which measurements should be included in the statistics calculations and timeline graph.
How Selection Works
- Statistics show latest static and dynamic values. Graph displays "Select measurements to display".
- That specific measurement is used for calculations and shown on graph.
- Averages are calculated across all selected measurements of each type. All selected points appear on the timeline graph.
Persistent Selection
Your selection is saved to local storage and persists between sessions. Each borehole remembers its own selection.Timeline Graph
The timeline graph visualizes water level changes over time for selected measurements.
Graph Features
- Shows depth in meters. Automatically scales to fit all selected data points with padding.
- Shows measurement dates. Rotated labels for better readability. Duplicate dates are shown once.
- Green circles for static levels, blue circles for dynamic levels. Connected by lines to show trends.
- Top-left corner shows static (green) and dynamic (blue) indicators.

Exporting the Graph
Click the download icon in the top-right corner of the graph to export as a JPG image. The filename includes the borehole name and current date.

Practical Example
Export the timeline graph to include in pumping test reports. The graph shows water level recovery patterns after pumping stops, useful for calculating aquifer transmissivity.Measurements Table
The scrollable table displays all water level measurements, sorted by date (newest first). All fields support inline editing.
Table Columns
- Checkbox to include/exclude measurement from calculations and graph.
- Click to edit using datetime picker. Change when measurement was taken.
- Click to edit depth value. Use Tab or Enter to save changes.
- Dropdown to switch between Static and Dynamic. Changing to Static clears the pumping rate.
- Pumping rate for dynamic levels. Disabled (grayed out) for static measurements.
- Red trash icon. Requires confirmation before deletion.
Inline Editing Tips
- Click any cell to edit the value
- Press Enter to save and move to next row
- Press Escape to cancel changes
- Click outside or Tab away to save
- Selected rows (checked for calc) have a light blue background
Water Levels in Export
Water levels can be visualized on borehole logs in the Export tab using dedicated export items.
Export Items
- Displays a horizontal blue line with triangle marker at the latest static water level depth.
- Displays a horizontal teal line with triangle marker at the latest dynamic level. Shows pumping rate below if available.
Visualization Settings
Click the settings icon on water level export items to customize:
- Solid, Dashed, or Dotted lines.
- Triangle marker size from 4 to 12 pixels.
- Depth only (5.20), with unit (5.20 m), or custom format.
Practical Example
Add both static and dynamic water level items to your borehole log layout. Use dashed lines for water levels to distinguish them from stratigraphy boundaries. This clearly shows the groundwater conditions for engineering reports.Best Practices
For Pumping Tests
- Record static level before pumping starts (allow well to stabilize if recently pumped)
- Record dynamic levels at regular intervals (1 min, 5 min, 15 min, 30 min, 1 hr, etc.)
- Always include pumping rate with dynamic measurements
- Record recovery levels after pumping stops to analyze aquifer recharge
For Long-Term Monitoring
- Record static levels at consistent times (e.g., monthly on the 1st)
- Use the timeline graph to identify seasonal variations
- Export graphs for annual groundwater reports
- Select date ranges using checkboxes to analyze specific periods
For Data Quality
- Verify depth measurements against borehole total depth
- Double-check pumping rates match field records
- Use consistent units (depths in meters, rates in L/sec)
- Record exact measurement times, not approximate dates