CPT Data Tab
Deep Dive
Import, view, and analyze Cone Penetration Test data. Automatic calculations for corrected cone resistance, friction ratio, soil behavior type, and engineering parameters following Robertson methodology.
Interface Overview
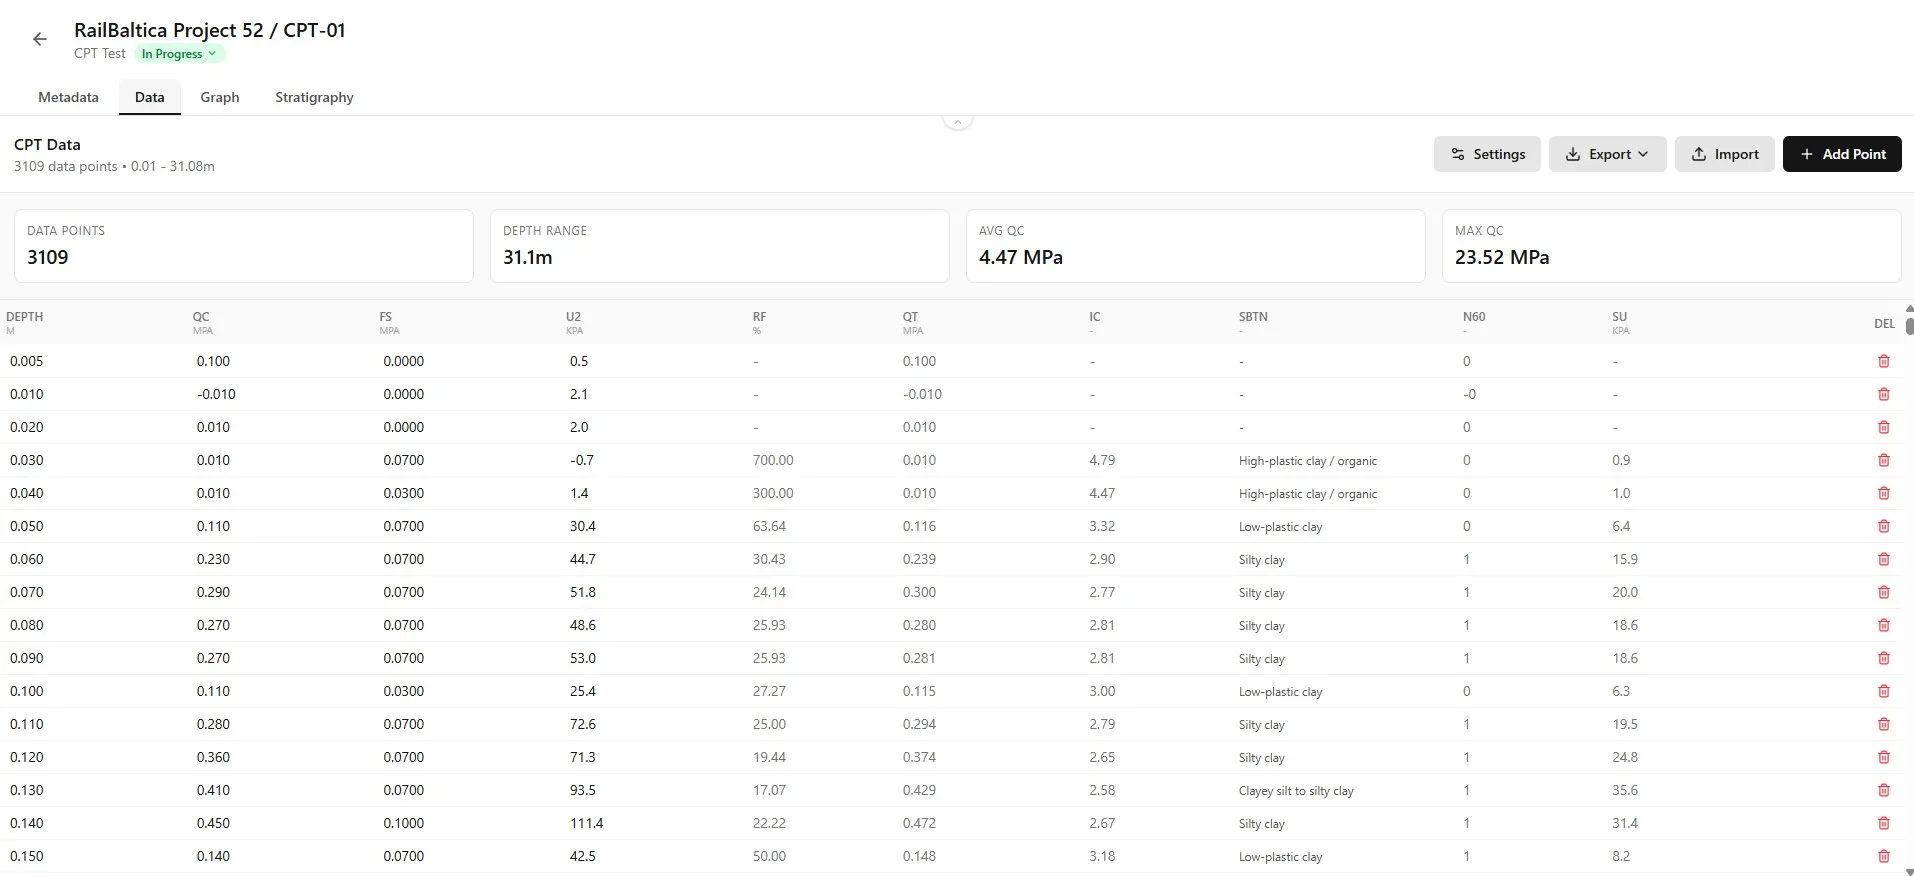
The CPT Data tab provides comprehensive data management with automatic calculations:
- Data point count, depth range, and action buttons (Settings, Export, Import, Add Point).
- Calculation parameters (water level, cone area ratio) and column visibility toggles.
- Quick statistics: data points count, depth range, average qc, maximum qc.
- Full data grid with raw measurements, calculated values, and engineering parameters.
Understanding Data Columns
Data columns are organized into three categories:
Raw Measurements (Editable)
| Column | Unit | Description |
|---|---|---|
| Measurement depth from surface | ||
| Cone resistance - tip pressure | ||
| Sleeve friction | ||
| Pore water pressure at u2 position | ||
| Temperature (optional) | ||
| Cone tilt angle (optional) | ||
| Penetration speed (optional) | ||
| Unit weight override (optional) |
Calculated Values (Read-Only)
Calculated columns derive normalized and engineering parameters from the raw data.
Engineering Parameters (Read-Only)
Engineering parameters (Ic, Su, E, M) are computed using Robertson 1990/2009 correlations.
Robertson Methodology
Calculations follow Robertson (1990, 2009, 2016) methodology. The soil behavior type index (Ic) is calculated from normalized Qt and Fr values.Importing CPT Data
Click "Import CSV" to open the import wizard. Supports CSV and Excel files with automatic format detection.
Drag & drop or browse to select your file

System auto-detects delimiter (;, comma, tab) and decimal separator

Review preview data and adjust data start row if headers exist

Map columns: select which file column corresponds to depth, qc, fs, u2

Set unit conversions (depth in m or cm, qc in MPa or kPa)

Set water level for calculations

Choose whether to delete existing data or append

Click Import to process data

Choose the columns to import and map them to Borebase parameters.

Confirm the preview and click Import to add the data to the CPT object.

Import Options
- Skip header rows (default: row 1 is first data row).
- Convert from cm to m if needed.
- MPa or kPa (auto-converted to MPa).
- Depth to groundwater for pore pressure calculations.
- Replace all existing data vs append new data.
- Continue import even if some rows have errors.
Data Quality Checks
The import wizard detects and warns about: missing values, text in number columns, unit strings (MPa, kPa), special symbols, and duplicate depth values.Practical Example
Exporting from Geotech software often produces semicolon-delimited files with comma decimal separators (European format). The import wizard auto-detects this and handles the conversion automatically.Calculation Parameters
Click the "Settings" button to open the calculation parameters panel.

Water Level (m)
Depth to groundwater from surface. Used to calculate hydrostatic pressure (u0) and effective stress (σ'v0). Critical for accurate Ic classification.
Cone Area Ratio (a)
The ratio of cone net area to gross area, typically 0.70-0.85. Used to correct qc for pore pressure effects:
Recalculating Data
After changing parameters, click "Apply & Recalculate" to update all calculated values. This recalculates qt, Rf, stress values, Ic, SBT, and engineering parameters for all data points.

Getting Parameters
The cone area ratio is provided by the CPT equipment manufacturer. Water level can be measured in the field or estimated from nearby boreholes.Column Visibility Settings
The Settings panel includes column visibility toggles to customize your view.

Column Categories
- Depth, qc, Fs, u2, Temp, Tilt, Speed, γ
- Rf, u0, Δu, qt, σv0, σ'v0, Qt, Fr, Bq, Ic, SBTn
- N60, Su, E, M
Click category headers to expand/collapse. Click individual column tags to toggle visibility. Settings persist between sessions.
Export Only Visible
Check "Export only visible columns" to limit CSV/Excel exports to currently displayed columns only. Useful for creating focused reports.

Practical Example
For a quick soil classification report, show only: Depth, qc, Rf, Ic, and SBTn. Then export to Excel for a clean, focused dataset.Inline Editing
Raw measurement columns support inline editing for data corrections.
- Click any raw data cell (depth, qc, fs, u2, etc.) to edit
- Type the new value (both comma and dot accepted as decimal separator)
- Press Enter or click away to save
- Press Escape to cancel
- Calculated columns (gray text) automatically update after edit

Automatic Recalculation
When you edit a raw value, the system automatically recalculates all derived parameters for that row (qt, Rf, Ic, SBT, N60, Su, etc.).Adding and Deleting Points
Opens a form to add a single data point. Enter depth, qc, fs, u2. Calculations run automatically.


- Remove individual data points. Requires confirmation.
- In Settings panel, removes all data points. Requires double confirmation.
Exporting Data
Click the Export dropdown to download data in CSV or Excel format.


CSV Export
- UTF-8 encoded with BOM for Excel compatibility
- Column headers include units (e.g., "qc (MPa)")
- SBTn column includes description column
- Filename: {objectName}_cpt_calculations.csv
Excel Export
- Professional formatting with monochrome styling
- Header section with object name, project, data point count, depth range, generation date
- Alternating row colors for readability
- Filename: {objectName}_cpt_data_{date}.xlsx
Practical Example
Export to Excel for client deliverables - the formatted report includes all metadata and is ready for attachment to geotechnical reports without additional formatting.Soil Behavior Type Classification
The SBTn column shows the normalized Soil Behavior Type based on Robertson's classification.
SBT Zones
| Column | Zone | Description |
|---|---|---|
| Sensitive fine-grained | ||
| Organic soils - clay | ||
| Clays - silty clay to clay | ||
| Silt mixtures | ||
| Sand mixtures - silty sand to sandy silt | ||
| Sands - clean sand to silty sand |
Ic Calculation
Ic = √[(3.47 - log Qt)² + (log Fr + 1.22)²]Best Practices
For Data Import
- Verify water level before importing - it affects all calculations
- Check unit settings match your source data (cm vs m, MPa vs kPa)
- Review import warnings for data quality issues
- Use "Delete existing" carefully - consider keeping historical data
For Analysis
- Verify cone area ratio matches your equipment specifications
- Check for anomalous qc spikes that might indicate obstructions
- Compare SBT zones with nearby borehole stratigraphy
- Use the Graphs tab for visual QC of data trends
For Reporting
- Export to Excel for formatted client deliverables
- Use column visibility to focus exports on relevant parameters
- Include water level and cone area ratio in report documentation
- Use Export tab for professional PDF logs with stratigraphy